
Every show, costed three times
ShowPlanr is a touring and booking platform for live entertainment. We rebuilt it on a new stack and put the promoter's hardest sum at the centre of it: what a night will make, what it might make now, and what it actually made.
A tour is a hundred small bets
A promoter books a date months before anyone buys a ticket. They agree a fee with the artist, a split with the venue, a marketing budget, and a dozen other terms that only matter if the night goes well, or badly enough. Then they wait, watch tickets trickle in, and decide whether to spend more on advertising or cut their losses.
Most of that runs on spreadsheets. One workbook per tour, passed around by email, with the deal terms in a corner and a formula nobody wants to touch. It works until there are forty dates, three people editing and a question about which version is current.
ShowPlanr already existed and already did some of this. The job was to rebuild it properly: the same business, a new stack, and the arithmetic moved out of the workbook and into the system.
Forecast, revised, actual
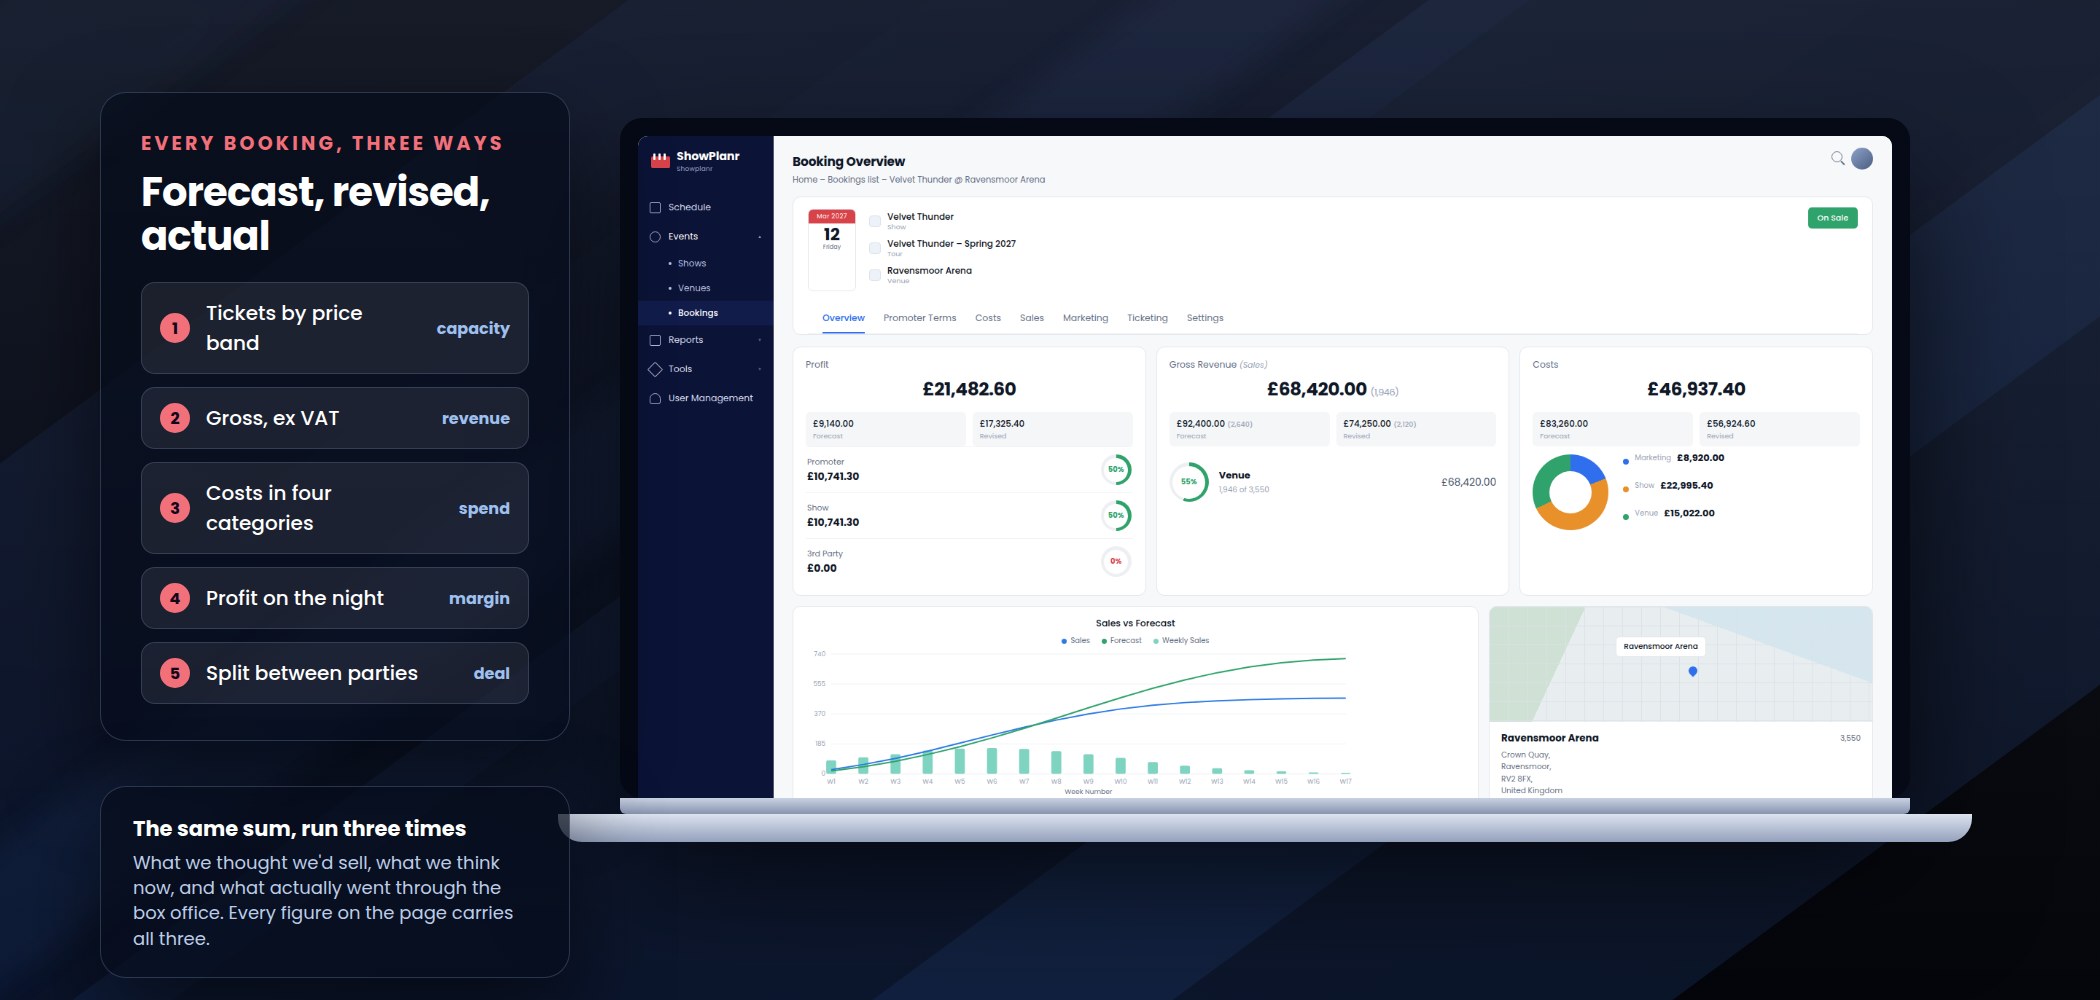
Every money figure in ShowPlanr exists three times. Forecast is what was believed when the date was booked. Revised is what is believed now, halfway through the on-sale. Actual is what came through, summed from the ticket sales themselves rather than stored as a running total.
Tickets live on price bands, so a booking's forecast is a number per band rather than one number for the room. Sales arrive as positive deltas against an allocation of a band — a row per source per day — which means the actual figure is always a sum, never a stale snapshot somebody forgot to update.
after three scenarios on every booking, recalculated from the sales table
outcome the same question answered the same way on every date in the book
Gross is carried excluding VAT throughout, which sounds like a detail until you are weighing a flat guarantee against a percentage of the door and the two are quoted differently.
Buyouts are their own sale type. Where a show is bought outright there is no ticket curve to follow, and the actual gross is the fee rather than the box office.
Costs fall down the hierarchy
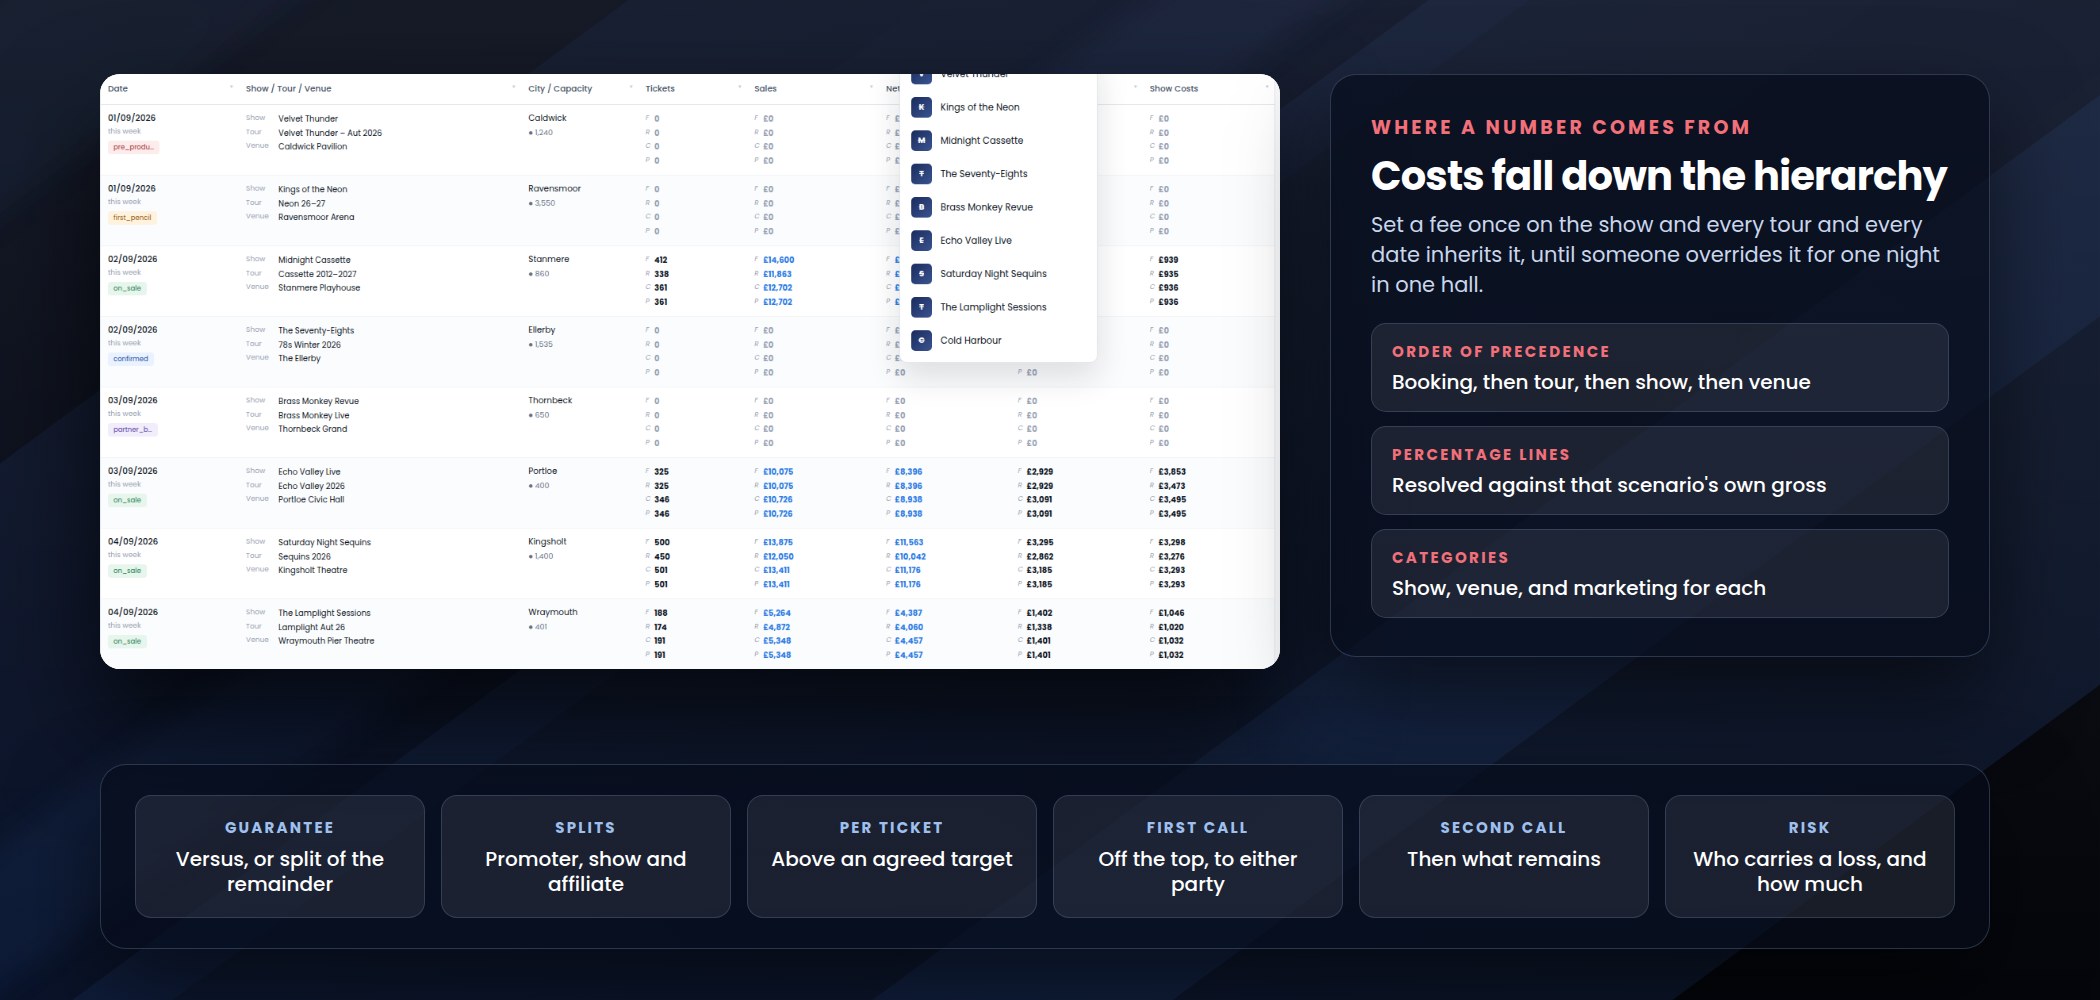
A touring production carries the same costs night after night — crew, trucking, sound, insurance, the artist's fee — and then one hall charges differently for security and another absorbs the marketing. Re-entering all of it per date is how errors get in.
So a cost is set once, at whatever level it is actually true, and everything below inherits it. The booking's figure wins if it has one; otherwise the tour's, otherwise the show's, otherwise the venue's. Seventy-four cost lines across show, venue and marketing categories, each resolving down that chain, and percentage-based lines resolving against the gross for whichever scenario is being calculated.
A cost typed into forty rows of a workbook, thirty-nine of them still correct.
Set once where it's true, inherited everywhere below, overridden only where it isn't.
The deal, written down as arithmetic
The hard part is not the profit. It is who gets it. A promoter deal can carry a guarantee set against a split, a per-ticket payment above an agreed target, a first call off the top to one party and a second call to another, an affiliate taking a cut, and a different apportionment of risk if the night loses money.
That calculation lives in a stored function in the database, taking a profit, a ticket count and nineteen deal-term fields and returning the split three ways. Putting it there rather than in application code means a report across four hundred dates computes the splits in the same query that computes the profit, instead of pulling every booking into memory to do it a row at a time.
Terms cascade the way costs do. Agree them on the show, and every tour and every date created underneath inherits them, until someone negotiates something different for one night.
Is this show selling, or is it just early?
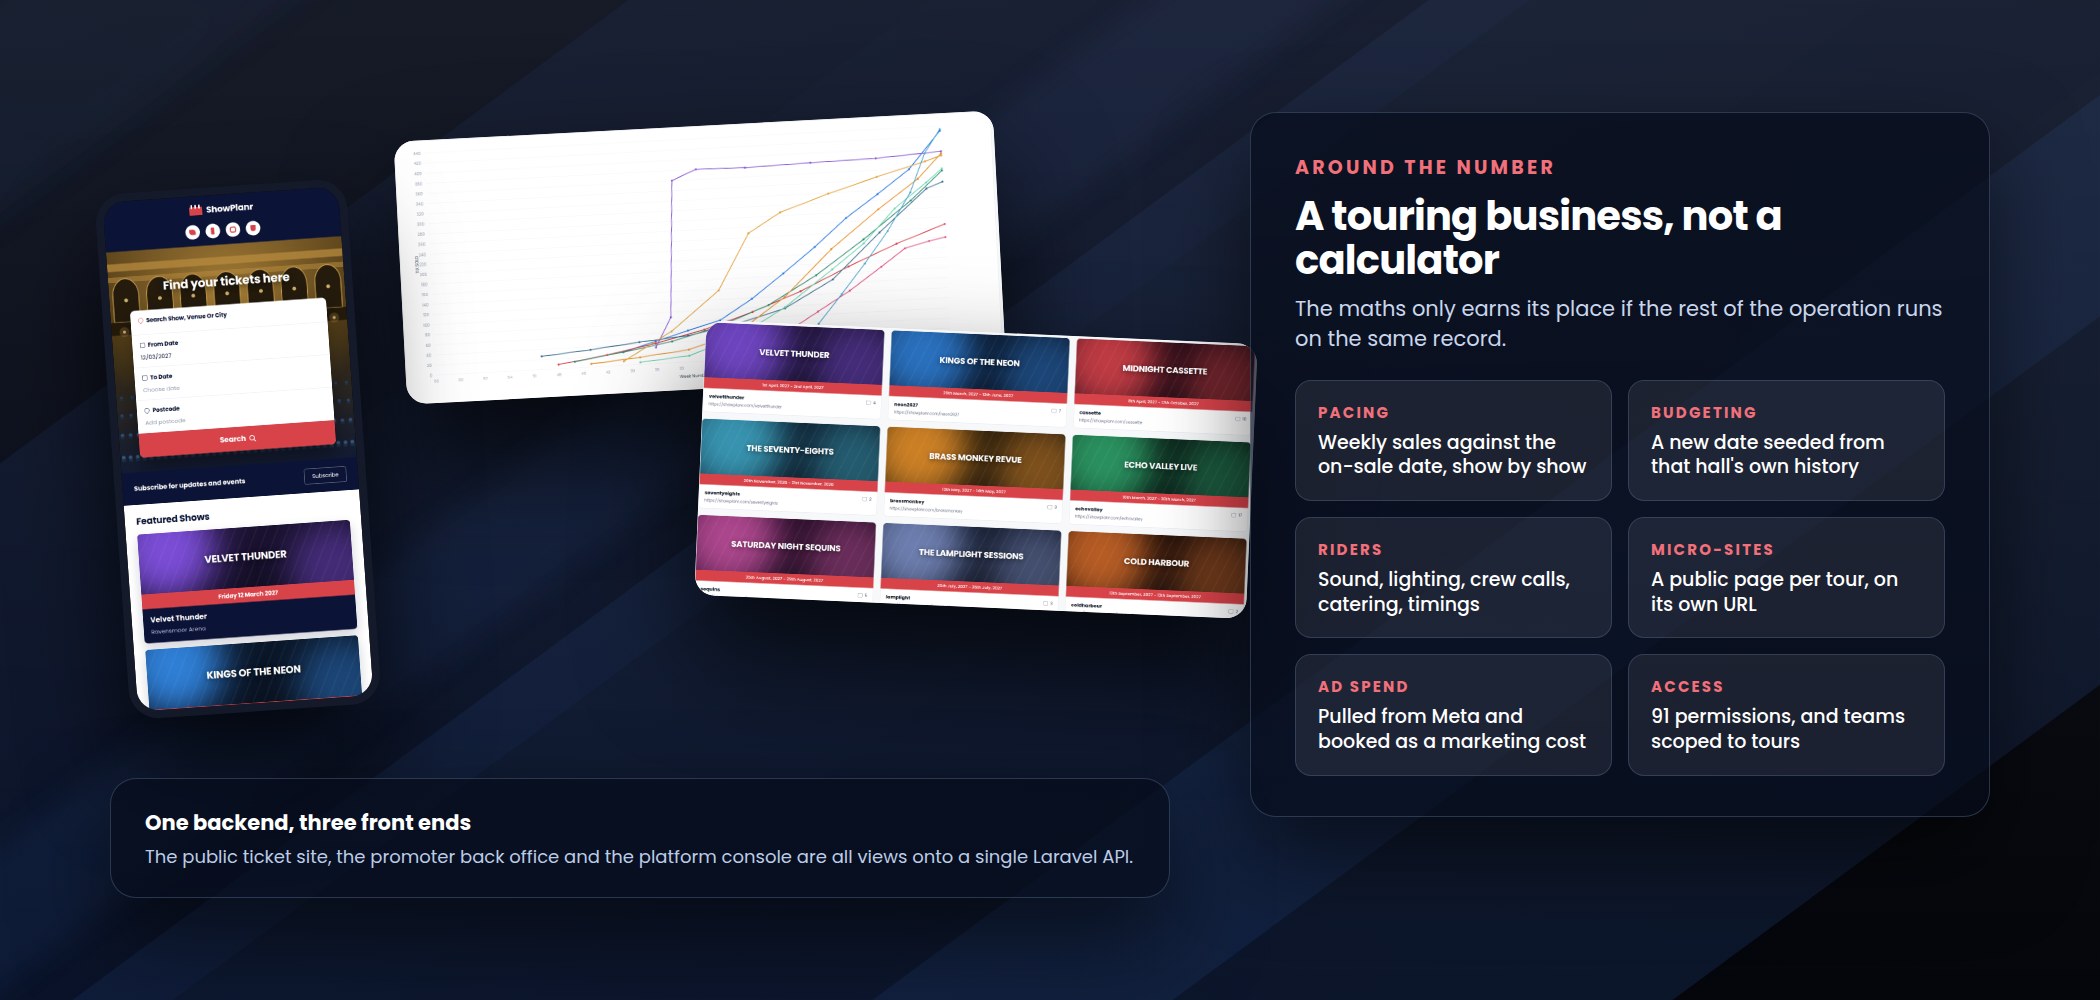
Sales for a live date follow a curve, not a line: a spike at on-sale, a long flat middle, and a rush in the final fortnight. A date at forty per cent eight weeks out can be healthy or dead, and the difference is whether you have seen that shape before.
A number in a spreadsheet and someone's instinct about whether it's enough.
This week measured against the same week on every comparable date you've played.
Each booking gets an on-sale target — four months before the date, unless someone sets otherwise — and a week grid generated from it with a weight per week. The forecast is distributed along that curve and the actual sales laid over it, so the question stops being how many have we sold and becomes are we ahead or behind at this point in the sell. A new date's forecast is seeded from the same venue's own history: what comparable shows actually did in that room, rather than what somebody hoped.
Moving a live touring business
The old system was still running the business, so the new one had to be filled from it. That is an eight-stage import — shows, media, venues, tours, bookings, deal terms, sales, ad sets — run in order, resumable, with a per-stage timing report and the option to skip or re-run any single stage.
The interesting problems were the mismatches. The old schema held forecast and revised ticket counts on the booking; the new one holds them per price band, so each figure is distributed across the bands with the remainder going to the most expensive first. Bookings with no tour had tours synthesised for them, grouped by show, with start and end dates derived from the bookings themselves. Sales stored as running totals became deltas, with negative steps clamped and logged rather than silently accepted.
Every booking imports inside its own transaction. A bad row rolls back, gets logged with its old identifier, and the import carries on — because at that volume the alternative is a migration that fails at ninety per cent and starts again.
Where it stands
ShowPlanr is live. The public ticket site, the promoter back office and the platform console all run on the same Laravel API, so a rule about how a split is calculated, or about who is allowed to see a deal, is written down in one place.
The product belongs to its owner, not to us. Our part was the rebuild: the API, the two front ends, the calculation engine, and the migration that moved a working touring business onto it without stopping the tours.
Is your margin still living in a spreadsheet?
The systems that run real operations are usually a workbook that grew. Moving one into software is less about features than about writing down arithmetic nobody has ever had to state precisely — and then making it survive a hundred edge cases. We have made that move before, for a business that could not pause while we did it.
.avif)